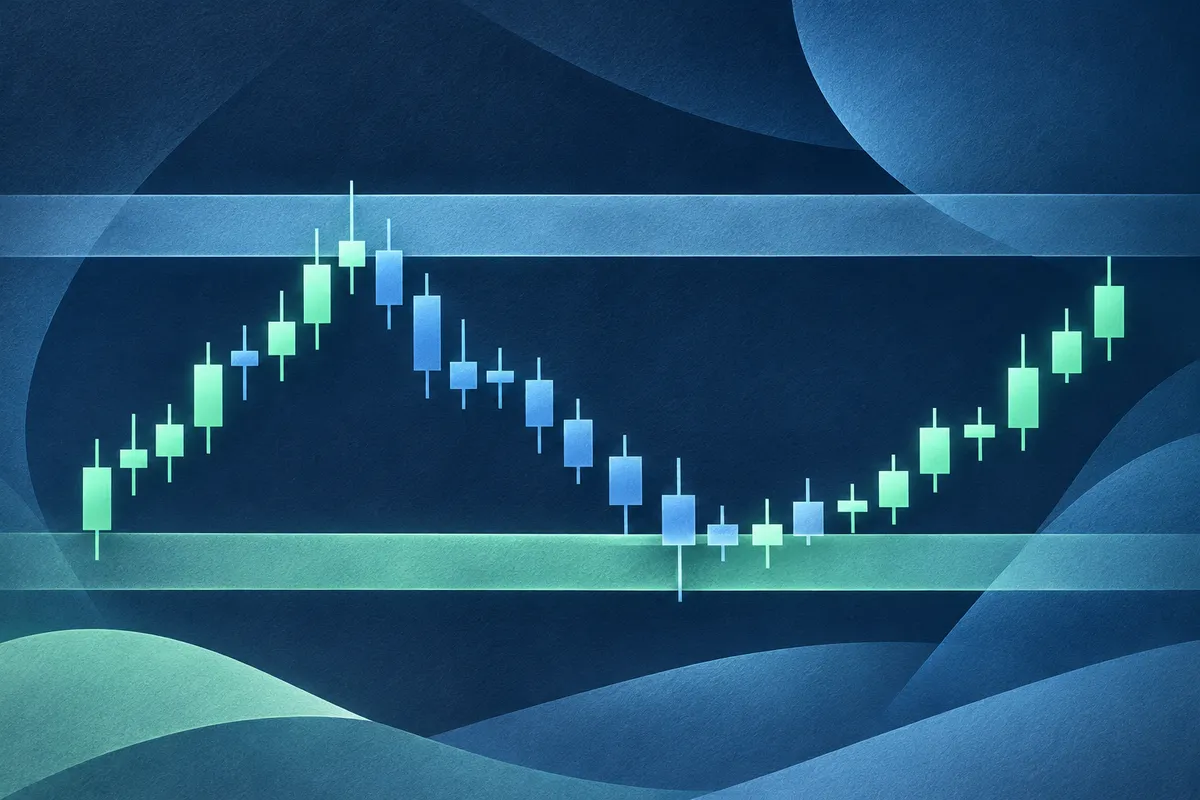
Support and resistance are areas where traders have previously seen buying or selling interest. They are reference points for reading a chart, not walls that price cannot cross. The most useful analysis combines levels with trend, timeframe and the event context.
Think in zones, not exact lines
A support area is a region where a decline has previously slowed or reversed. Resistance is a region where a rise has stalled. Markets do not always turn at the same pip: different providers may show slightly different prices, and a pair can briefly move through a level before returning.
Repeated reactions can make a zone more visible, but they do not ensure another reversal. A price level that holds in a quiet session may fail after a policy surprise or a change in the wider trend.
Start with the broader structure
Before marking individual levels, zoom out. Is the pair making higher highs and higher lows, lower highs and lower lows, or moving sideways? A trend gives context to pullbacks and breakouts. A horizontal level viewed without that context can invite a story that the wider chart does not support.
Use consistent timeframes. A level that matters on a daily chart may look less significant on a five-minute chart. Mark a small number of clear zones rather than covering the screen with every historical turn.
Volume, momentum and confirmation
Forex is a fragmented over-the-counter market, so there is no single consolidated trading-volume feed for the whole market. Some chart providers show tick volume or data from one venue. Treat those readings as a partial view, not total global activity.
Momentum indicators can help describe whether price movement is accelerating or slowing, but they are based on past prices and can lag. A candle close beyond a level, a retest or a change in market structure may offer additional context; none removes the possibility of a false breakout.
Combine chart reading with fundamentals
Economic releases and central-bank communication can invalidate a technical setup quickly. A chart records how prices have moved; it does not reveal every reason why market participants are buying or selling. Use the economic calendar and price action together, and consider whether a move began before a headline or followed it.
Explore recent history on a currency pair chart and compare the latest forex rates across major pairs. Technical analysis is one framework for organizing observations, not a reliable prediction of future price. Set risk limits appropriate to your circumstances.